7.08.2009
Technology Adoption Graph
>

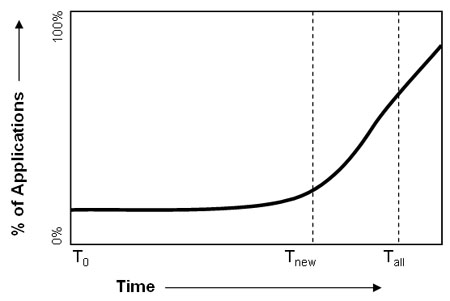
Dan Bricklin, the co-developer of the early spreadsheet program VisiCalc has this chart on his site, showing the interval between the development of a technology and its adoption. Sometimes the interval is short, sometimes it is long, or it may never happen.
For example, if you walk into the lobby of SRI in Menlo Park there is a memorial to the computer mouse. You can read how SRI played a role in the early development of this technological cast-off by creating and licensing it, in addition to helping Walt Disney figure out which orange grove to build Disneyland in, rather than Burbank. Years later, the mouse became ubiquitous.
Where the interval is long, presumably, user behavior catches up with the vision, market reaction is accelerated by some means, or the product is configured in such a way as to appeal to a broader market (usually components of the above) in addition to enhanced usability or friendliness.
Since people make snap judgments based on just a few milliseconds of detection and analysis, a friendly simple ap is a lot more likely to be loved than something really complex and you know, unfriendly.

![]()
